Call it what you will: org chart, organization(al) chart, organigram/organogram, or organizational breakdown structure. It goes by many names, but one thing is for sure: an org chart is a diagram that visually portrays the internal structure of a company. It details stakeholder roles and responsibilities, and even the relationships and reporting structures between them.
Table of Contents
What is an Organizational Chart?
An organizational chart is a diagram that visually presents an organization’s internal structure. Org charts visualize your contact data and show the relation from one individual to another, or from one department or function to another. To put it in slightly different words, an organizational chart illustrates the ties between individuals within an organization. These relationships are mapped based on the level of responsibility and rank an employee holds in the specific company, often placing the principal executives, departments and functions on top, and the others below, according to their position in the internal hierarchy.
What Does an Org Chart Look Like?
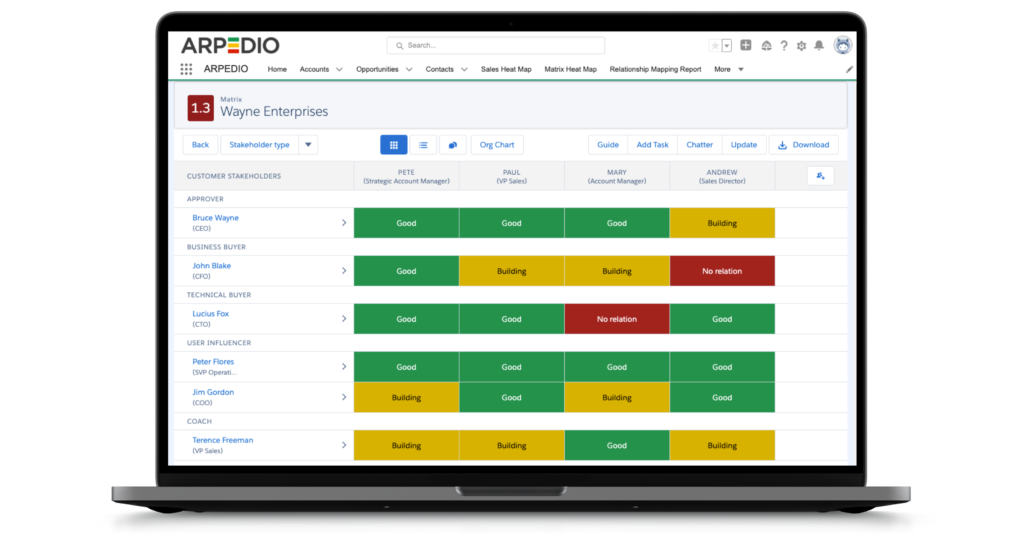
Organizational charts can be presented in many different ways. Three examples are hierarchical, matrix and flat (also known as horizontal). However, the most common way to depict and portray an organization is by using the hierarchical model. You’ve probably seen an org chart like this at some point: the C-level executives on top with lines leading down to middle management, and finally continuing to staff-level employees at the bottom of the org chart. The individuals’ names and titles are usually enclosed in boxes or circles. When a company’s org chart becomes too big, it can be (further) split into smaller charts depicting separate departments or business units within that company.
Org Chart Examples
Curious to see what some different org charts look like? See example below:
Why Are Visual Org Charts Important?
When we talk about the importance of mapping accounts in organizational charts to drive complex sales and account management, the main factors to consider are: (1) the number of stakeholders in a buying group has exploded, and (2) the human brain consumes visuals faster. Let’s dive further into these two points in the following:
1. The number of stakeholders in a buying group has exploded
According to Gartner, the typical buying group for a complex B2B solution involves six to 10 decision makers. This is an increase by six compared to 40 years ago. Therefore, it’s simply no longer sufficient to rely completely on a single individual. If your ‘confidant’ for whatever reason leaves the company, all your hard work will be wasted, and your slice of the pie will go straight out the window.
With the increase in the number of customer-side stakeholders involved in making complex B2B purchasing decisions, it’s hard work to get that final signature. It’s not enough to simply identify all the relevant decision makers, you also need to fully understand their role, responsibility, position in the company hierarchy, decision power, etc.
This might seem like a no-brainer. Yet surprisingly, even the most experienced sales- and account professionals sometimes underestimate the importance of this crucial information. For this reason, we can’t stress enough how essential it is to map out the key stakeholders involved in a buying decision to fully understand their role in the organization’s hierarchy, not to mention their pain points, and what drives them.
2. The human brain consumes visuals faster
On a different yet highly relevant note, research shows that 77 percent of organizations that use data visualization experience an improvement in company decision making. And additionally, 44 percent enhance collaborative skills among working teams.
Furthermore, research from 3M Corporation concludes that the human brain processes images 60,000 times faster than text. Thus, there’s no getting around that a visual representation of data is much more comprehensive compared to the same information in a text format.
Because of our ability to easily take in visual information, organizational charts let us interpret large amounts of critical data quickly. This way, using org charts in your account planning and relationship mapping can help increase visibility into your accounts while improving the speed and accuracy of critical decision making.
These are a few of the reasons why org charts are so important. They offer a visual display that supports you in keeping track of the relevant stakeholders and identify the roadmap to the key decision makers. Additionally, org charts can help you discover unrecognized points of entry and spot red flags before it’s too late. And this leads us straight to the next section, because org charts are not just org charts. Org charts have evolved rapidly in recent years, and below we’ll take a look at why the traditional org charts are no longer sufficient.
Why ‘Traditional’ Org Charts Are No Longer Sufficient
The first org chart dates all the way back to the 1850’s, and the way we use and present org charts has come a long way since then. And that’s a good thing.
Org charts are ever-changing, and the challenge of keeping them up to date is the main reason why traditional organizational charts are no longer sufficient in today’s complex B2B sales. Stakeholders will move around internally, they will get new jobs in new companies, they will get fired, and they will go on leave. It’s inevitable. And everytime a change happens – big or small – the org chart changes too.
Therefore, keeping an org chart up to date is a never ending task. And one thing is having to continuously update your org charts, another is keeping track of all this critical information in your head – it’s simply impossible.
Org charts that need to be updated manually can very quickly become out of date – especially in large organizations where personnel change regularly.
And just like that, creating organizational charts in PowerPoint or even on pieces of paper is simply no longer sufficient. (…not really sure it ever was). No sales or account professionals want to spend their precious time making org charts that will never be updated, so let’s once and for all bury the ‘traditional’ org charts and start leveraging powerful org chart software.
What is Org Chart Software?
Org charts were once manually created reporting structures on pieces of paper. Today, thanks to technology, they are highly effective – and some would say indispensable – digital sales tools for strategic account management. It’s safe to say that org chart software is here to stay.
More specifically, org chart software is a software tool that allows you to visually represent your company’s or your accounts’ hierarchical structure and reporting relationships directly in your chosen CRM. So instead of making and updating your org charts manually or using a basic template, org chart software inside your CRM can help you create professional and interactive org charts to illustrate the relationships across departments, functions and workforce in no time.
As the Head of Sales, setting the scene for success is on your table. And the best way to ensure that your KAM and SAMs are selling at their full potential is to provide them with the tools that allow them to work more efficiently. To get all the key decision makers on board in a complex sales situation is not a walk in the park. It can be challenging – even for the most experienced account professionals. Therefore, tools that support productivity and efficiency can play a key role in your relationship mapping efforts.
Salesforce Org Chart Software
If you prefer to keep building your org charts manually, go ahead. But maybe it’s time to leave the digital stone age behind and start leveraging intelligent sales enablement software inside your CRM to create state of the art org charts.
ARPEDIO’s Org Chart Software is 100% native to Salesforce and automatically creates interactive organizational charts by using the contact data you already have in Salesforce – quickly and easily. As you edit your contact data, this will automatically be updated in your org chart, as well as any changes you make in your org chart will be updated in your contact data. This is an absolute game changer that increases your overall data quality and ensures that your org charts are always fully up to date.
In short, ARPEDIO’s Org Chart Software allows you to:
- Create valuable organizational charts in a matter of seconds
- Edit and update with a super easy drag and drop functionality
- Export, print and share with colleagues or external stakeholders
What Are the Benefits of Org Chart Software?
Let’s dig a little deeper into the benefits of org chart software. A visual presentation of your accounts supports strategic organizational planning, and allows for sales- and account professionals to be much more efficient. Leveraging org charts as part of your relationship mapping is your chance to identify the blind spots, i.e., new opportunities and entry points, as well as the ability to zoom in on red flags to protect existing business lines before it’s too late to act.
So, say goodbye to org charts in PowerPoint that need your constant attention in order to be kept up to date. The use of org chart software saves you precious time by automatically updating your organizational charts based on your contact data.
Last but not least, by implementing intelligent org chart software, you can easily identify relevant stakeholders and get the full picture of their buying roles, responsibilities and experience. This valuable information is key when you’re creating your sales action plan.
By now, the benefits of leveraging org chart software should be crystal clear. Let’s take a look at how combining ARPEDIO’s Org Chart and Relationship Mapping solutions in Salesforce can create great synergy and take your account planning and relationship mapping even further.
Org Charts and Relationship Mapping Inside Salesforce
By combining ARPEDIO’s Org Chart and Relationship Mapping software you can get all the critical information you need about the key stakeholders involved in a buying situation in a single view.
ARPEDIO’s Relationship Mapping software as an additional feature in your existing Salesforce setup gives you the opportunity to assess your stakeholders on relevant parameters such as availability, power structure and support level, and thus provide you with a nuanced picture of the critical decision makers. Along with transparency into your stakeholder relationships, you’ll be able to easily pinpoint where you have support and where you need to focus your efforts to grow and strengthen your relationships. To put it simple and to the point, ARPEDIO’s Relationship Mapping software allows you to map, manage and improve your critical stakeholder relationships directly in Salesforce. All these efforts will ultimately help your account professionals maximize retention, generate more revenue from existing clients, not to mention win new ones.
Are you using Saleforce today?
#1 Account-Based Selling Platform
Powerful alone. Superior together.
Boost win rates and reduce sales cycles. Enhance forecast accuracy.

