In the dynamic landscape of sales, understanding and leveraging sales metrics is not just advantageous—it’s imperative. Sales metrics serve as the compass guiding businesses toward their goals, providing invaluable insights into performance, identifying areas for improvement, and ultimately driving revenue growth.
Welcome to our comprehensive guide on mastering sales metrics. Whether you’re a seasoned sales professional or just dipping your toes into the world of sales analytics, this blog post will equip you with the knowledge and tools necessary to navigate the intricate realm of sales metrics with confidence and precision.
Understanding Sales Metrics
In the realm of sales, metrics serve as the compass guiding businesses toward their objectives, offering invaluable insights into performance and opportunities for growth. Let’s delve deeper into understanding sales metrics and their significance in driving success.
What are Sales Metrics? And What is the Purpose?
Sales metrics, in essence, are quantifiable measures used to track and analyze various aspects of the sales process. They provide tangible data points that enable businesses to assess the effectiveness of their sales efforts and make informed decisions to optimize performance and drive revenue growth. The primary purpose of sales metrics is to provide actionable insights that facilitate strategic decision-making and continuous improvement.
Types of Sales Metrics
Sales metrics can be broadly categorized into two main types: leading indicators and lagging indicators.
Leading Indicators: Leading indicators are predictive metrics that provide insights into future sales performance. These metrics enable businesses to anticipate trends, identify potential opportunities or challenges, and take proactive measures to address them before they impact results. Examples of leading indicators include lead quality, sales pipeline velocity, and activity levels of sales representatives.
Lagging Indicators: Lagging indicators, on the other hand, are historical metrics that reflect past sales performance. While they may not provide immediate insights into future outcomes, lagging indicators offer valuable benchmarks for evaluating past performance and identifying areas for improvement. Common lagging indicators include total sales revenue, customer churn rate, and average deal size.
Leading Indicators
Leading indicators are predictive metrics that offer insights into future sales performance. They provide early signals of potential trends or outcomes, allowing businesses to take proactive measures to capitalize on opportunities or mitigate risks. Here are some examples of leading indicators:
Lead Quality: Assessing the quality of leads generated can serve as a leading indicator of future sales success. High-quality leads are more likely to convert into paying customers, while low-quality leads may indicate potential challenges in the sales process.
Sales Pipeline Velocity: The speed at which prospects move through the sales pipeline can be a leading indicator of sales performance. A fast-moving pipeline suggests strong momentum and potential for achieving sales targets, while a sluggish pipeline may signal obstacles that need to be addressed.
Activity Levels of Sales Representatives: Monitoring the activity levels of sales representatives, such as the number of calls made, emails sent, and meetings scheduled, can provide insights into their engagement with prospects and the likelihood of converting leads into customers.
Lagging Indicators
Lagging indicators are historical metrics that reflect past sales performance. While they may not offer immediate insights into future outcomes, lagging indicators provide valuable benchmarks for evaluating past performance and identifying areas for improvement. Here are some examples of lagging indicators:
Total Sales Revenue: Total sales revenue represents the sum of all revenue generated over a specific period. While it reflects past sales performance, it serves as a key indicator of overall business success and financial health.
Customer Churn Rate: Customer churn rate measures the percentage of customers who stop doing business with a company over a given period. While churn rate reflects past customer retention efforts, it also highlights the effectiveness of customer satisfaction and retention strategies.
Average Deal Size: Average deal size represents the average value of individual sales transactions. Tracking this metric over time provides insights into changes in customer behavior, market trends, and the effectiveness of sales strategies.
Key Performance Indicators (KPIs) in Sales
Within the realm of sales metrics, certain key performance indicators (KPIs) hold particular significance due to their direct impact on business success. These KPIs span across different stages of the sales process and provide insights into critical aspects of sales performance. Let’s explore three essential categories of KPIs in sales:
Revenue Metrics: Revenue metrics focus on tracking and analyzing the financial aspects of sales performance. Key revenue metrics include total sales revenue, revenue growth rate, average revenue per customer, and gross profit margin. These metrics provide insights into the overall health and profitability of the sales operation.
Conversion Metrics: Conversion metrics measure the effectiveness of converting prospects into paying customers. These metrics help businesses evaluate the efficiency of their sales funnel and identify opportunities for optimization. Common conversion metrics include lead-to-opportunity conversion rate, opportunity-to-close ratio, and win rate.
Activity Metrics: Activity metrics gauge the productivity and effectiveness of sales representatives in engaging with prospects and advancing deals through the sales process. Examples of activity metrics include the number of calls made, emails sent, meetings scheduled, and demos conducted. By tracking these metrics, businesses can assess the level of sales activity and identify potential areas for improvement or coaching.
Understanding these key categories of sales metrics and their respective KPIs is essential for developing a comprehensive approach to sales performance measurement and optimization. By leveraging a mix of leading and lagging indicators across revenue, conversion, and activity metrics, businesses can gain a holistic view of their sales performance and take targeted actions to drive success.
Revenue Metrics
Revenue metrics focus on tracking and analyzing the financial aspects of sales performance. They provide insights into the overall health and profitability of the sales operation. Here are some examples of revenue metrics:
Total Sales Revenue: Total sales revenue represents the total amount of revenue generated from sales activities within a specific period, such as a month, quarter, or year.
Revenue Growth Rate: Revenue growth rate measures the percentage increase or decrease in sales revenue over a specific period compared to the previous period. It indicates the pace at which a company’s sales are expanding or contracting.
Average Revenue Per Customer: Average revenue per customer calculates the average amount of revenue generated per customer over a specific period. It helps businesses understand the value of individual customers and tailor their sales and marketing efforts accordingly.
Conversion Metrics
Conversion metrics measure the effectiveness of converting prospects into paying customers. They help businesses evaluate the efficiency of their sales funnel and identify opportunities for optimization. Here are some examples of conversion metrics:
Lead-to-Opportunity Conversion Rate: Lead-to-opportunity conversion rate measures the percentage of leads that progress to the opportunity stage in the sales process. It indicates the effectiveness of lead qualification and the quality of leads generated.
Opportunity-to-Close Ratio: Opportunity-to-close ratio measures the percentage of opportunities that successfully convert into closed deals. It reflects the efficiency of the sales team in advancing opportunities through the sales pipeline and closing deals.
Win Rate: Win rate calculates the percentage of opportunities that result in successful sales. It provides insights into the competitiveness of the sales process and the effectiveness of sales strategies in winning deals.
Activity Metrics
Activity metrics gauge the productivity and effectiveness of sales representatives in engaging with prospects and advancing deals through the sales process. Here are some examples of activity metrics:
Number of Calls Made: The number of calls made measures the volume of outbound calls made by sales representatives to engage with prospects and qualify leads.
Emails Sent: Emails sent measures the volume of outbound emails sent by sales representatives to communicate with prospects, follow up on leads, and nurture relationships.
Meetings Scheduled: Meetings scheduled measures the number of meetings or appointments scheduled by sales representatives with prospects to discuss products or services and advance deals through the sales process.
Demos Conducted: Demos conducted measures the number of product demonstrations or presentations delivered by sales representatives to prospects to showcase the features and benefits of products or services.
By understanding and leveraging these different kinds of sales metrics, businesses can gain valuable insights into their sales performance, identify areas for improvement, and drive growth and profitability.
Essential Sales Metrics to Track
In the realm of sales performance measurement, certain metrics stand out as essential indicators of success. Tracking these metrics provides businesses with valuable insights into their sales operations and enables informed decision-making to drive growth and profitability. Let’s explore the essential sales metrics that every business should track:
Sales Revenue
Sales revenue is perhaps the most fundamental metric in sales performance measurement. It represents the total amount of revenue generated from sales activities within a specific period, such as a month, quarter, or year. Tracking sales revenue provides businesses with a clear understanding of their financial performance and serves as a primary indicator of overall sales success.
Customer Acquisition Cost (CAC)
Customer Acquisition Cost (CAC) measures the amount of money a business spends on acquiring a new customer. It includes expenses related to marketing, sales, and other activities aimed at acquiring customers. Calculating CAC helps businesses evaluate the effectiveness and efficiency of their customer acquisition efforts and ensures that the cost of acquiring customers is sustainable and profitable.
Customer Lifetime Value (CLV)
Customer Lifetime Value (CLV) represents the total revenue a business can expect to generate from a single customer over the entire duration of their relationship. Calculating CLV helps businesses understand the long-term value of their customers and informs strategic decisions related to customer acquisition, retention, and relationship management.
Sales Conversion Rate
Sales Conversion Rate measures the percentage of prospects or leads that successfully convert into paying customers. It reflects the efficiency of the sales process in turning leads into sales and provides insights into the effectiveness of sales strategies and tactics. Improving the sales conversion rate can lead to increased revenue and improved sales performance.
Average Deal Size
Average Deal Size calculates the average value of individual sales transactions. It provides insights into the typical size and value of deals closed by the sales team and helps businesses assess the health and profitability of their sales pipeline. Monitoring average deal size over time can identify trends and opportunities for increasing sales revenue.
Sales Velocity
Sales Velocity measures the speed at which deals move through the sales pipeline from initial contact to closed sale. It takes into account factors such as deal size, conversion rate, and sales cycle length to provide insights into the efficiency and effectiveness of the sales process. Increasing sales velocity can lead to faster revenue generation and improved sales performance.
Sales Pipeline Metrics
Pipeline Value: Pipeline Value represents the total value of all deals currently in the sales pipeline. It provides visibility into the potential revenue that can be generated in the future and helps businesses forecast sales performance and plan resources accordingly.
Pipeline Velocity: Pipeline Velocity measures the speed at which deals move through the sales pipeline. It calculates the average time it takes for a deal to progress from one stage of the pipeline to the next and provides insights into the efficiency of the sales process in advancing deals toward closure.
Pipeline Conversion Rate: Pipeline Conversion Rate measures the percentage of deals that successfully progress through each stage of the sales pipeline. It helps businesses identify potential bottlenecks or areas for improvement in the sales process and ensures that opportunities are effectively managed and nurtured toward closure.
Tracking these essential sales metrics provides businesses with valuable insights into their sales performance, enabling them to identify opportunities for improvement, optimize strategies, and drive sustainable growth and profitability. By leveraging data-driven insights, businesses can make informed decisions to achieve their sales objectives and stay ahead in today’s competitive market landscape.
Using Sales Metrics to Drive Performance Improvement
Sales metrics serve as powerful tools not only for measuring performance but also for driving continuous improvement within sales teams. By leveraging data-driven insights, businesses can identify areas for optimization and implement strategies to enhance sales effectiveness and efficiency. Let’s explore how sales metrics can be used to drive performance improvement:
Sales Coaching and Training
Sales metrics provide valuable insights into the strengths and weaknesses of individual sales representatives. By analyzing metrics such as conversion rates, activity levels, and deal sizes, sales managers can identify areas where sales reps may need additional coaching or training. Targeted coaching sessions can help improve sales skills, overcome challenges, and ultimately drive better performance.
Performance Incentives and Rewards
Sales metrics can also be used to design performance incentive programs that motivate and reward sales teams for achieving specific goals. By aligning incentives with key metrics such as sales revenue, conversion rates, and pipeline value, businesses can encourage desired behaviors and drive performance improvement. Incentives can take the form of monetary rewards, bonuses, recognition, or other perks that motivate sales representatives to excel.
Process Optimization
Analyzing sales metrics can reveal inefficiencies or bottlenecks in the sales process that hinder performance. By identifying areas for optimization, businesses can streamline processes, remove obstacles, and improve the overall efficiency of the sales operation. For example, if the sales conversion rate is low at a particular stage of the sales funnel, businesses can investigate potential reasons for the drop-off and implement changes to address the issue.
Continuous Monitoring and Adjustments
Sales metrics should be monitored regularly to track progress, identify trends, and make necessary adjustments to sales strategies. By continuously monitoring key metrics, businesses can stay agile and responsive to changes in the market environment, customer preferences, and competitive landscape. Regular review meetings and performance evaluations can provide opportunities to discuss insights from sales metrics and make data-driven decisions to drive ongoing improvement.
By leveraging sales metrics to drive performance improvement initiatives such as sales coaching, incentive programs, process optimization, and continuous monitoring, businesses can empower their sales teams to achieve greater success and drive sustainable growth. By making data-driven decisions and taking proactive steps to address areas for improvement, businesses can stay competitive and thrive in today’s dynamic sales landscape.
Common Pitfalls to Avoid in Sales Metric Analysis
While sales metrics provide valuable insights into performance and opportunities for improvement, it’s essential to approach their analysis with caution. Falling into common pitfalls can lead to misinterpretation of data and ineffective decision-making. Let’s explore some common pitfalls to avoid in sales metric analysis:
Focusing Solely on Revenue
While revenue is a critical metric, focusing solely on revenue can be misleading. It’s essential to consider other key performance indicators (KPIs) such as conversion rates, customer acquisition cost (CAC), and customer lifetime value (CLV) to gain a holistic understanding of sales performance. By diversifying the metrics analyzed, businesses can identify underlying factors contributing to revenue trends and make more informed decisions to drive growth.
Ignoring Leading Indicators
Leading indicators provide valuable insights into future sales performance by identifying early signals of potential trends or outcomes. Ignoring leading indicators and focusing solely on lagging indicators can result in missed opportunities to anticipate challenges and take proactive measures to address them. By incorporating leading indicators into sales metric analysis, businesses can better predict future outcomes and make timely adjustments to sales strategies.
Overlooking Contextual Factors
Sales metrics should be analyzed within the context of broader market dynamics, customer behavior, and internal factors impacting sales performance. Overlooking contextual factors such as seasonality, industry trends, competitive landscape, and changes in customer preferences can lead to misinterpretation of data and ineffective decision-making. By considering contextual factors in sales metric analysis, businesses can gain a deeper understanding of performance drivers and make more accurate projections.
Neglecting Data Quality
The quality of data used in sales metric analysis is crucial for making reliable and actionable insights. Neglecting data quality issues such as incomplete, inaccurate, or outdated data can undermine the integrity of sales metric analysis and lead to erroneous conclusions. It’s essential to invest in data validation, cleansing, and maintenance processes to ensure the accuracy and reliability of sales data. By prioritizing data quality, businesses can trust the insights derived from sales metric analysis and make more informed decisions to drive performance improvement.
Avoiding these common pitfalls in sales metric analysis is essential for deriving meaningful insights and driving effective decision-making. By diversifying the metrics analyzed, incorporating leading indicators, considering contextual factors, and prioritizing data quality, businesses can harness the full potential of sales metrics to optimize performance and achieve their sales objectives.
Tools for Tracking and Analyzing Sales Metrics
In today’s data-driven business environment, leveraging the right tools for tracking and analyzing sales metrics is essential for gaining actionable insights and driving performance improvement. Let’s explore some of the most effective tools available for tracking and analyzing sales metrics:
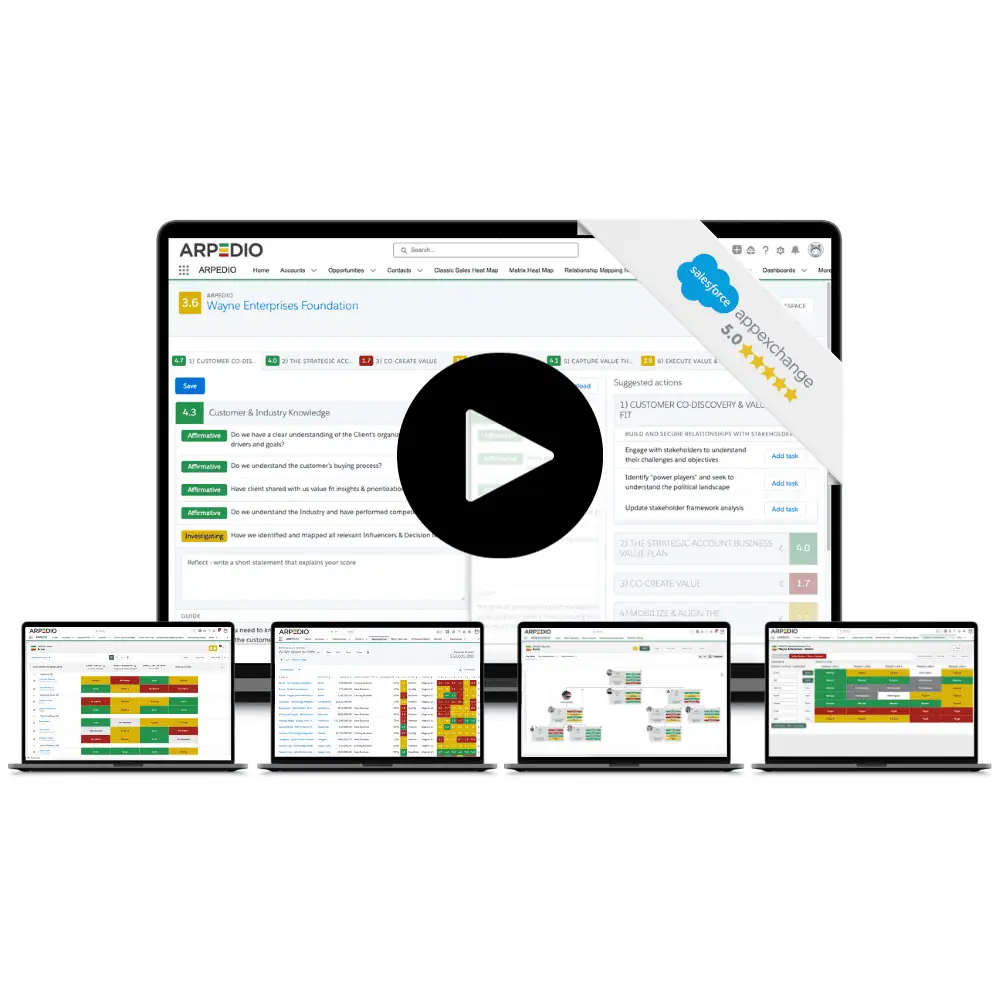
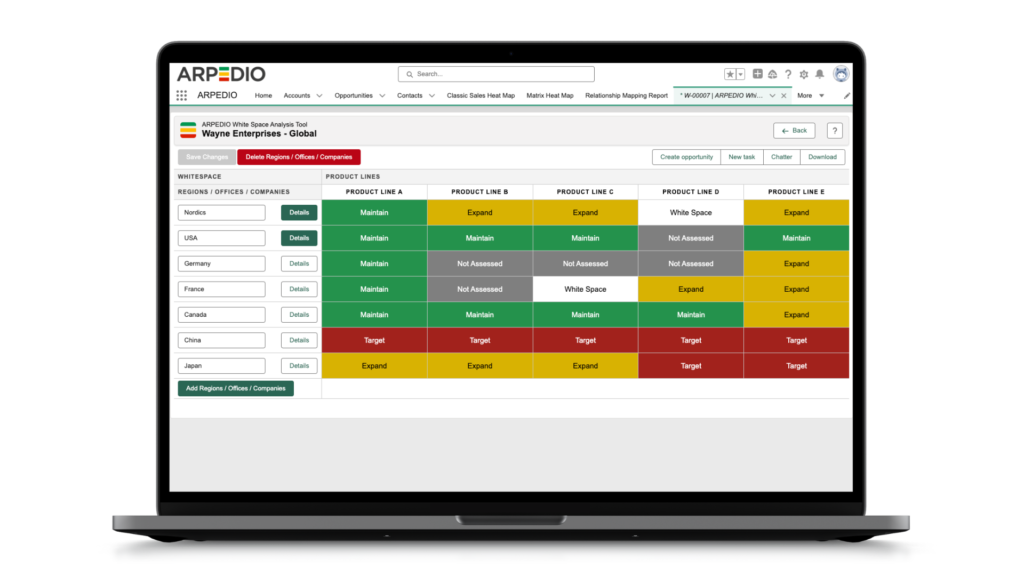
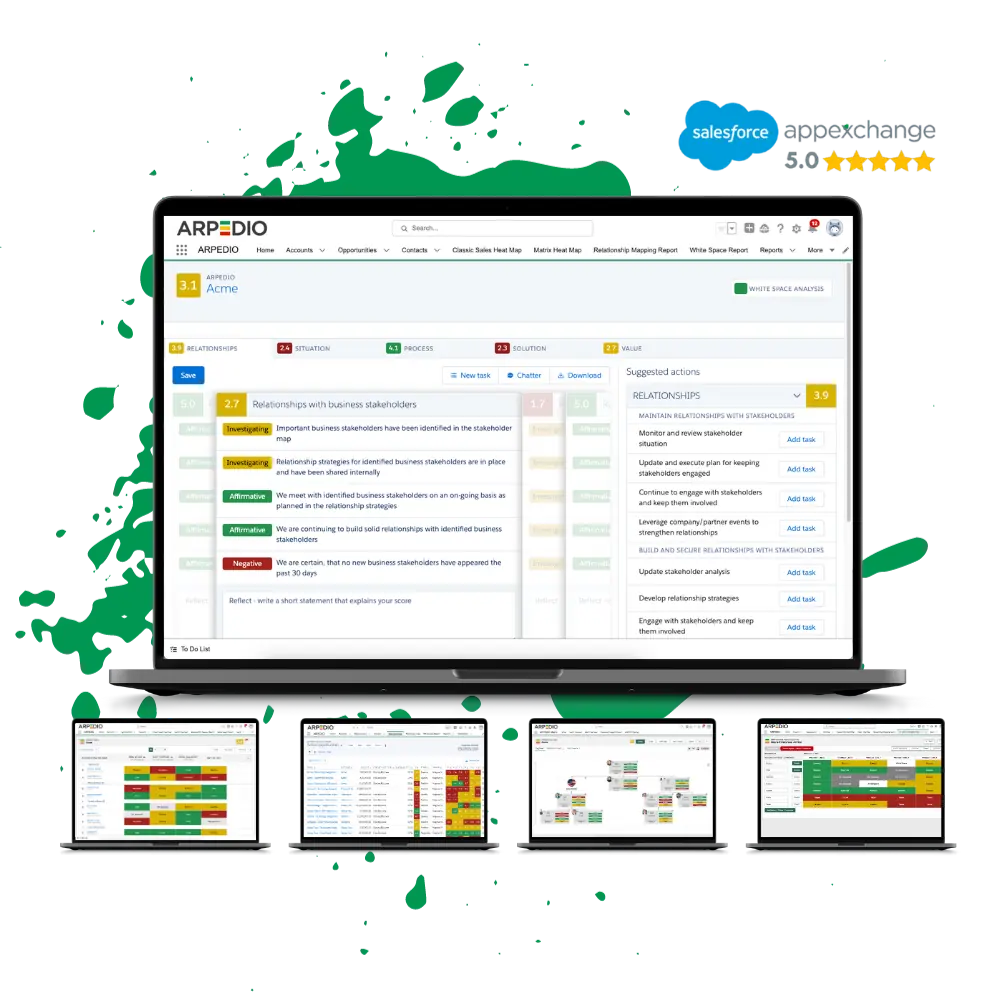
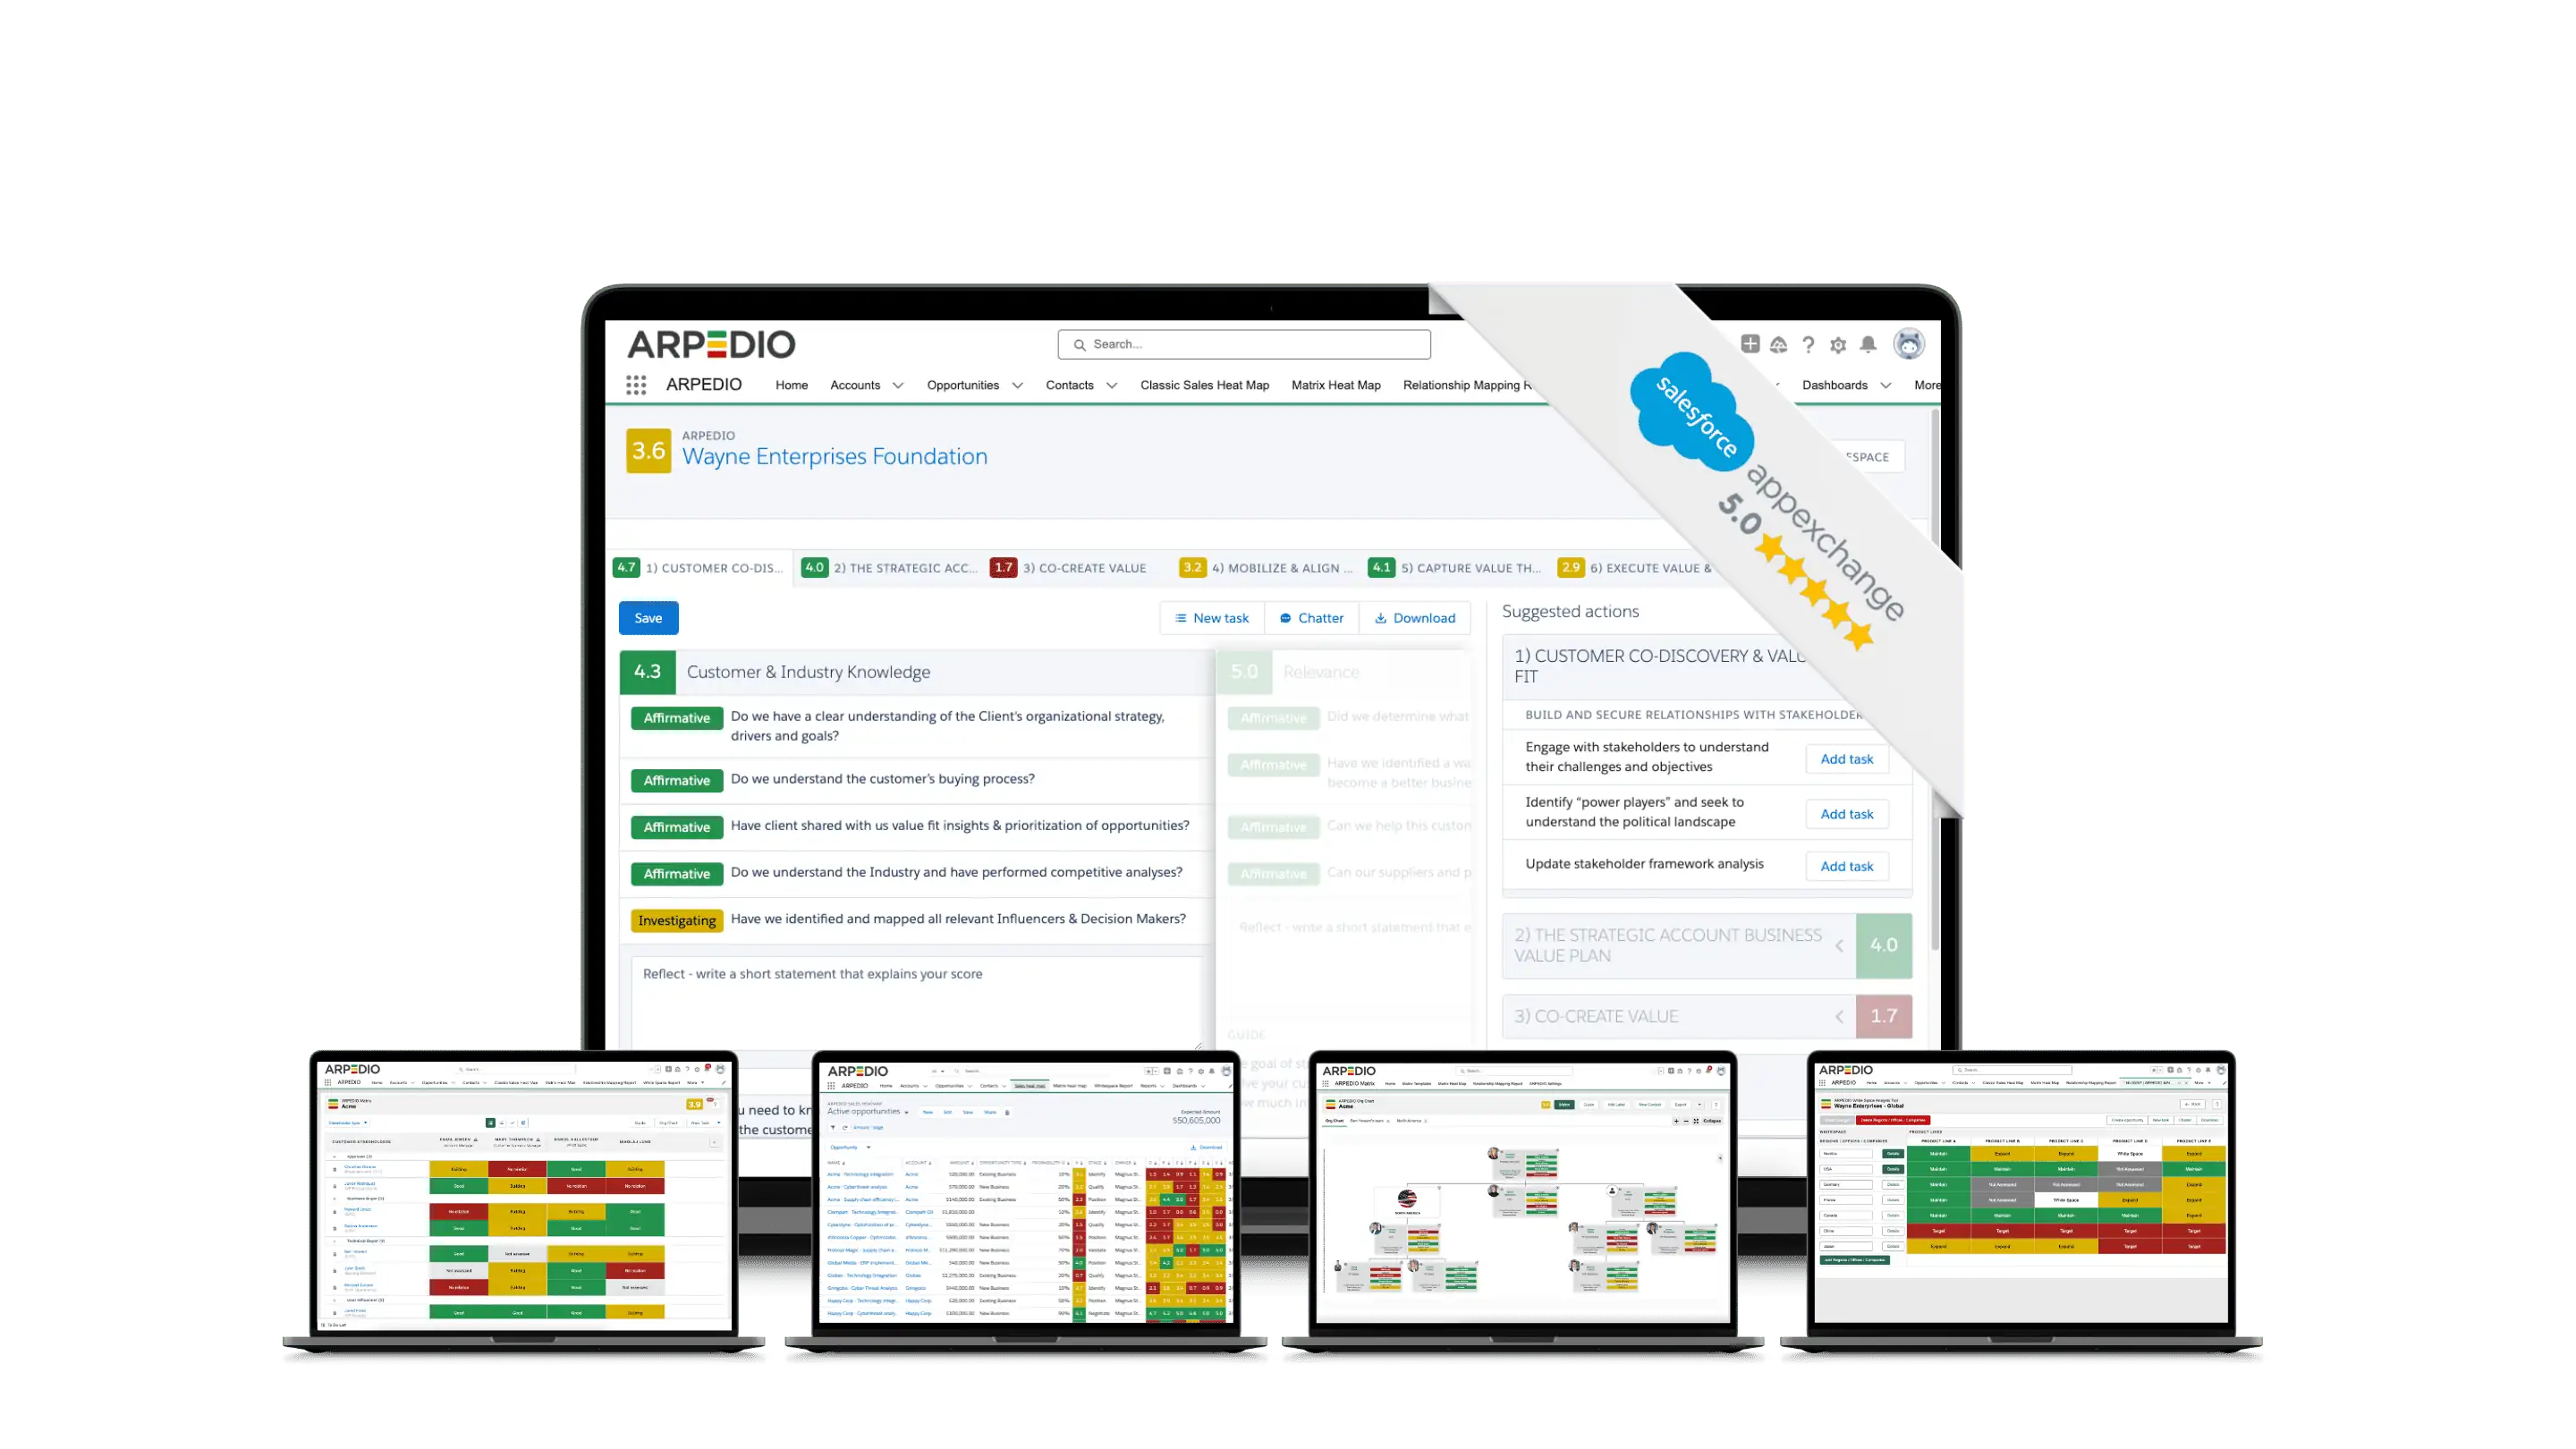
Salesforce & ARPEDIO
Customer Relationship Management (CRM) software, such as Salesforce combined with ARPEDIO’s Account-Based Selling Platform, serves as the central hub for managing customer interactions, tracking sales activities, and analyzing sales performance. CRM software allows businesses to capture and organize customer data, track sales leads and opportunities, and monitor the progress of deals through the sales pipeline. Additionally, CRM software provides robust reporting and analytics capabilities, allowing businesses to generate custom reports and dashboards to track key sales metrics and identify trends. By leveraging CRM software, businesses can streamline sales processes, improve customer relationships, and drive revenue growth.
Conclusion
Mastering sales metrics is not just about tracking numbers—it’s about unlocking the full potential of your sales operation to drive growth, profitability, and customer satisfaction. Throughout this comprehensive guide, we’ve explored the importance of sales metrics, essential metrics to track, common pitfalls to avoid, and tools for tracking and analyzing sales performance.
By understanding the diverse array of sales metrics, from revenue and conversion rates to pipeline velocity and activity levels, businesses can gain valuable insights into their sales operations and identify opportunities for improvement. Leveraging leading indicators, lagging indicators, and contextual factors allows businesses to anticipate trends, address challenges, and make informed decisions to optimize sales performance.
Moreover, utilizing tools such as Salesforce and ARPEDIO, empowers businesses to harness the power of data and analytics to drive performance improvement. These tools provide real-time visibility into key metrics, facilitate data-driven decision-making, and foster collaboration and accountability within sales teams.
As businesses continue to navigate the evolving landscape of sales, mastering sales metrics will remain a critical component of success. By embracing a data-driven approach, prioritizing continuous improvement, and leveraging the right tools and strategies, businesses can unlock new opportunities, exceed customer expectations, and achieve their sales objectives.
In conclusion, whether you’re a seasoned sales professional or just beginning your journey, the insights and strategies outlined in this guide will empower you to elevate your sales performance and drive sustainable growth in today’s competitive market environment. Here’s to leveraging the power of sales metrics to unlock your full potential and achieve greater success in your sales endeavors.